
If you have experience in creating a web application, you will likely be acquainted with console.log(…), a method used to display data in the developer console. It is beneficial for debugging, logging, and testing purposes.
Let’s outlines some neat tricks we can use to level up our logging experience.
Tables
The console.table() method is used to present objects and arrays in an organized and visually appealing tabular format.
console.table({
  'Time Stamp': new Date().getTime(),
  'OS': navigator['platform'],
  'Browser': navigator['appCodeName'],
  'Language': navigator['language'],
});
Groups
The console.group() method is used to create a new group of logs in the web console. This method allows us to group the content in a separate block, that will be indented.
We can optionally give a section a title, by passing a string as the parameter. Sections can be collapsed and expanded in the console, but we can also have a section collapsed by default, by using groupCollapsed instead of group. We can also nest sub-sections within sections but be sure to remember to close out each group with groupEnd.
console.group('URL Info');
  console.log('Protocol', window.location.protocol);
  console.log('Host', window.origin);
  console.log('Path', window.location.pathname);
  console.groupCollapsed('Meta Info');
    console.log('Date Fetched', new Date().getTime());
    console.log('OS', navigator['platform']);
    console.log('Browser', navigator['appCodeName']);
    console.log('Language', navigator['language']);
  console.groupEnd();
console.groupEnd();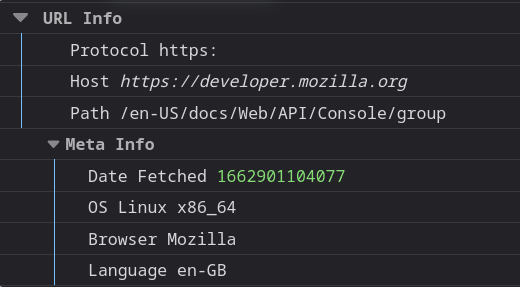
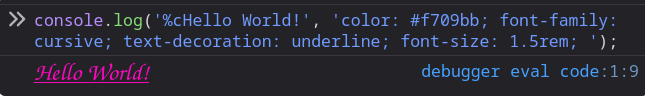
Styled Logs
It’s possible to style our log outputs with some basic CSS, such as colors, fonts, text styles and sizes.
PS: browser support for this is quite variable.
console.log(
  '%cHello World!',
  'color: #f709bb; font-family: sans-serif; text-decoration: underline;'
);
Time
One common way to debug code is by measuring execution time, which helps track how long an operation takes. To do this, you can start a timer using console.time() and assign a label, and then end the timer using console.timeEnd() with the same label.
console.time("concatenation");
let output = "";
for (var i = 1; i <= 1e6; i++) {
  output += i;
}
console.timeEnd("concatenation");
We can also add markers within a long running operation using console.timeLog()

Assert
The console. assert() method writes an error message to the console if the assertion is false. If the assertion is true, nothing happens
const errorMsg = 'the # is not even';
for (let num = 2; num <= 5; num++) {
  console.log(`the # is ${num}`);
  console.assert(num % 2 === 0, { num }, errorMsg);
}
Trace
In Angular, the console.trace() method outputs a stack trace to the Web console. This can be useful for tracking how and why a particular function was called. Here is a simple example:
import { Component, OnInit } from '@angular/core';

@Component({
  selector: 'app-example',
  template: '',
})
export class ExampleComponent implements OnInit {
  constructor() {}

  ngOnInit(): void {
    this.firstFunction();
  }

  firstFunction() {
    this.secondFunction();
  }

  secondFunction() {
    console.trace('Hier wird der Aufrufstapel protokolliert.');
  }
}
In this example, we have an Angular component ExampleComponent with two functions: firstFunction and secondFunction. When secondFunction is called, we use console.trace() to log the call stack. Now when you open the developer tools in your browser and use this component, you will see the call stack logged to show the path from which the function was called.
The console output might look something like this:
Trace
    at ExampleComponent.secondFunction (path-to-your-component.ts:16:15)
    at ExampleComponent.firstFunction (path-to-your-component.ts:12:15)
    at ExampleComponent.ngOnInit (path-to-your-component.ts:8:3)
    at callHook (core.js:2526)
    at callHooks (core.js:2492)
    at executeInitAndCheckHooks (core.js:2442)
    at refreshView (core.js:9529)
    at refreshDynamic (core.js:8706)
    at refreshView (core.js:9585)
    at refreshComponent (core.js:9696)
This shows the call stack, starting with the current function (secondFunction) and going backwards to the start point of the call. This can be very helpful in troubleshooting and understanding program flow in our Angular application.
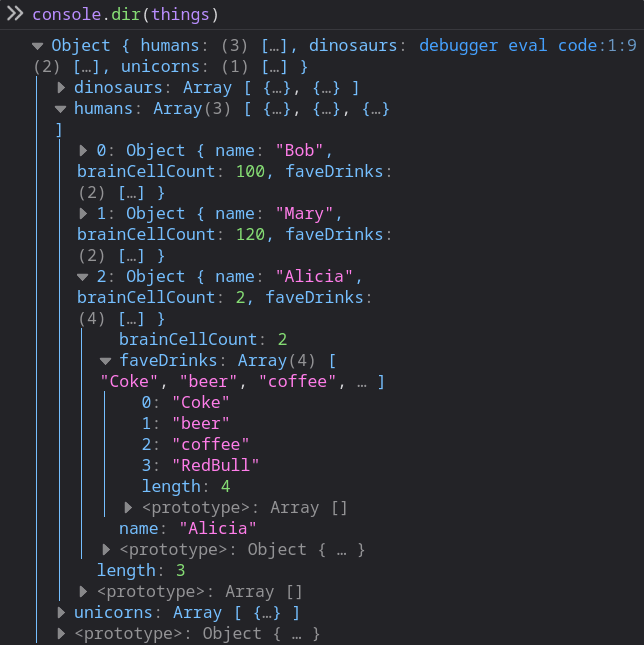
Dir
the console.dir() method is used mainly to display properties of an object. It outputs the list of properties of an object in a readable and interactive manner.